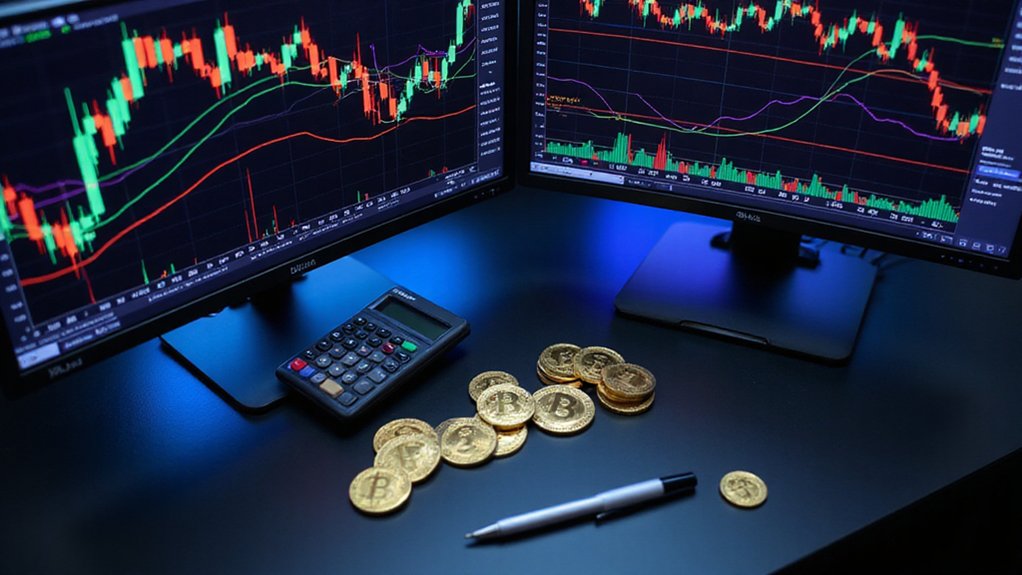
Essential cryptocurrency indicators include moving averages (simple and exponential) for trend identification, RSI and MACD for momentum analysis, and Bollinger Bands for volatility assessment. Volume indicators like On-Balance Volume reveal accumulation patterns, while advanced tools such as Fibonacci retracements and Ichimoku clouds provide thorough market analysis. The Fear and Greed Index gauges market sentiment, though these mathematical constructs occasionally prove as unpredictable as the markets themselves. Understanding their proper implementation and limitations transforms chaotic price action into strategic opportunities.

The labyrinthine world of cryptocurrency trading presents a peculiar paradox: while digital assets operate in markets that never sleep, traders desperately seek patterns in what often resembles organized chaos.
Technical indicators emerge as navigational tools in this digital wilderness, offering structure to markets where billion-dollar valuations can evaporate faster than morning dew.
Technical indicators serve as digital compasses in cryptocurrency’s volatile landscape, where fortunes vanish with algorithmic indifference.
Moving averages represent the most fundamental attempt to impose order upon chaos, smoothing price volatility through mathematical averaging.
Simple Moving Averages (SMA) calculate arithmetic means over specified periods, while Exponential Moving Averages (EMA) weight recent prices more heavily—because apparently, yesterday’s Bitcoin price matters more than last week’s (a reasonable assumption in markets where fortunes change hourly).
These indicators identify trend directions and potential support levels, filtering market noise with admirable persistence.
The Relative Strength Index operates as momentum’s measuring stick, oscillating between zero and one hundred with the reliability of a metronome.
Values above seventy suggest overbought conditions—market euphoria reaching dangerous heights—while readings below thirty indicate oversold territories where bargain hunters allegedly lurk.
This deceptively simple tool helps traders time entries and exits, though timing crypto markets often resembles predicting weather patterns on Jupiter.
Bollinger Bands construct volatility’s visual representation through standard deviation calculations, expanding during turbulent periods and contracting when markets achieve temporary tranquility.
Prices approaching upper bands suggest overbought conditions, while lower band proximity indicates oversold scenarios—assuming markets respect mathematical boundaries (an optimistic presumption).
On-Balance Volume connects price movements to trading volume, revealing accumulation patterns beneath surface price action.
Rising OBV accompanying price increases confirms bullish momentum, while divergence suggests weakening trends—volume never lies, though it occasionally whispers misleadingly.
MACD displays relationships between two EMAs, generating signals through line crossovers that traders follow with religious devotion.
This momentum indicator captures trend changes with mathematical precision, though crypto markets frequently ignore mathematical logic entirely. Effective implementation of these indicators requires robust risk management strategies to mitigate potential losses during periods of extreme market volatility.
The Fear and Greed Index serves as a barometer for market uncertainty, helping traders avoid emotional responses during periods of extreme sentiment.
Fibonacci retracements apply ancient mathematical sequences to modern digital chaos, identifying potential reversal levels at 23.6%, 38.2%, 50%, 61.8%, and 78.6% retracements.
The Ichimoku Cloud provides a comprehensive market view through its complex system of five lines, creating a holistic approach to trend identification that encompasses past, present, and future price action.
Support and resistance levels mark psychological battlegrounds where supply meets demand, creating invisible barriers that prices respect until they don’t—which happens with cryptocurrency’s characteristic unpredictability.
Frequently Asked Questions
How Often Should Cryptocurrency Indicators Be Checked During Volatile Market Conditions?
During volatile crypto conditions, traders should monitor indicators with frequency proportional to their strategy’s time horizon.
Intraday positions demand hourly scrutiny of Bollinger Bands and ATR adjustments, while swing traders can suffice with twice-daily assessments.
The paradox remains: excessive monitoring breeds overtrading, yet insufficient attention invites catastrophic gaps.
Savvy practitioners establish predetermined checkpoints—perhaps every four hours during high volatility—combining multiple indicators like Stochastic with OBV for validation rather than obsessively updating charts.
Which Indicators Work Best for Day Trading Versus Long-Term Investing Strategies?
Day traders gravitate toward RSI, MACD, and Bollinger Bands—indicators that generate frequent signals amid market chaos, though one might question whether such noise truly constitutes actionable intelligence.
Long-term investors, conversely, rely on 50/200-day moving averages, support/resistance levels, and Fibonacci retracements that filter volatility into digestible trends.
The irony? Short-term indicators demand constant vigilance while promising quick profits, whereas patient strategies using static levels require minimal monitoring yet often deliver superior returns.
Can Multiple Indicators Contradict Each Other and How Do You Resolve Conflicts?
Multiple indicators routinely contradict each other—RSI suggesting overbought conditions while MACD signals bullish momentum, creating delightful chaos for traders.
Seasoned practitioners resolve these conflicts through weighted hierarchies, prioritizing certain indicators based on market conditions and historical performance.
Smart money employs confluence analysis, requiring multiple confirmations before acting, while implementing robust risk management protocols.
The alternative? Paralysis by analysis, where conflicting signals breed indecision and missed opportunities.
Do Cryptocurrency Indicators Work Differently Than Traditional Stock Market Technical Indicators?
Cryptocurrency indicators utilize identical mathematical foundations as traditional stock market tools, yet their effectiveness diverges considerably due to crypto’s relentless 24/7 trading cycles and amplified volatility.
While RSI and moving averages function similarly across both markets, crypto’s fragmented liquidity and manipulation susceptibility necessitate parameter adjustments and shorter timeframes.
The absence of fundamental valuation metrics in crypto elevates technical indicators’ prominence, though paradoxically makes them less reliable than their stock market counterparts.
What’s the Minimum Account Size Needed to Effectively Use Advanced Trading Indicators?
There’s no minimum account size for advanced trading indicators—a welcome departure from traditional Wall Street gatekeeping.
Most exchanges require modest order minimums (Kraken’s 0.01 ETH threshold, for instance) rather than account balance requirements.
Technical indicators analyze price action universally, whether deployed on $100 or $100,000 portfolios.
The real constraint involves transaction fees potentially eroding small-account profits, making position sizing and broker selection more critical than raw capital accumulation.


